What Makes an SEO Reporting Dashboard Essential for Your Business?
Posted by
How to Build an Effective SEO Reporting Dashboard That Actually Drives Results

Creating an SEO reporting dashboard can feel overwhelming, especially when you're drowning in data from multiple tools and platforms. The truth is, most businesses struggle to transform their SEO metrics into actionable insights that drive real growth. A well-designed SEO reporting dashboard changes everything by consolidating your most critical performance indicators into a single, visual interface that tells the story of your search engine optimization efforts. In this comprehensive guide, you'll discover how to build a reporting system that not only tracks your SEO progress but actually helps you make better strategic decisions for your website's success.
What Makes an SEO Reporting Dashboard Essential for Your Business?
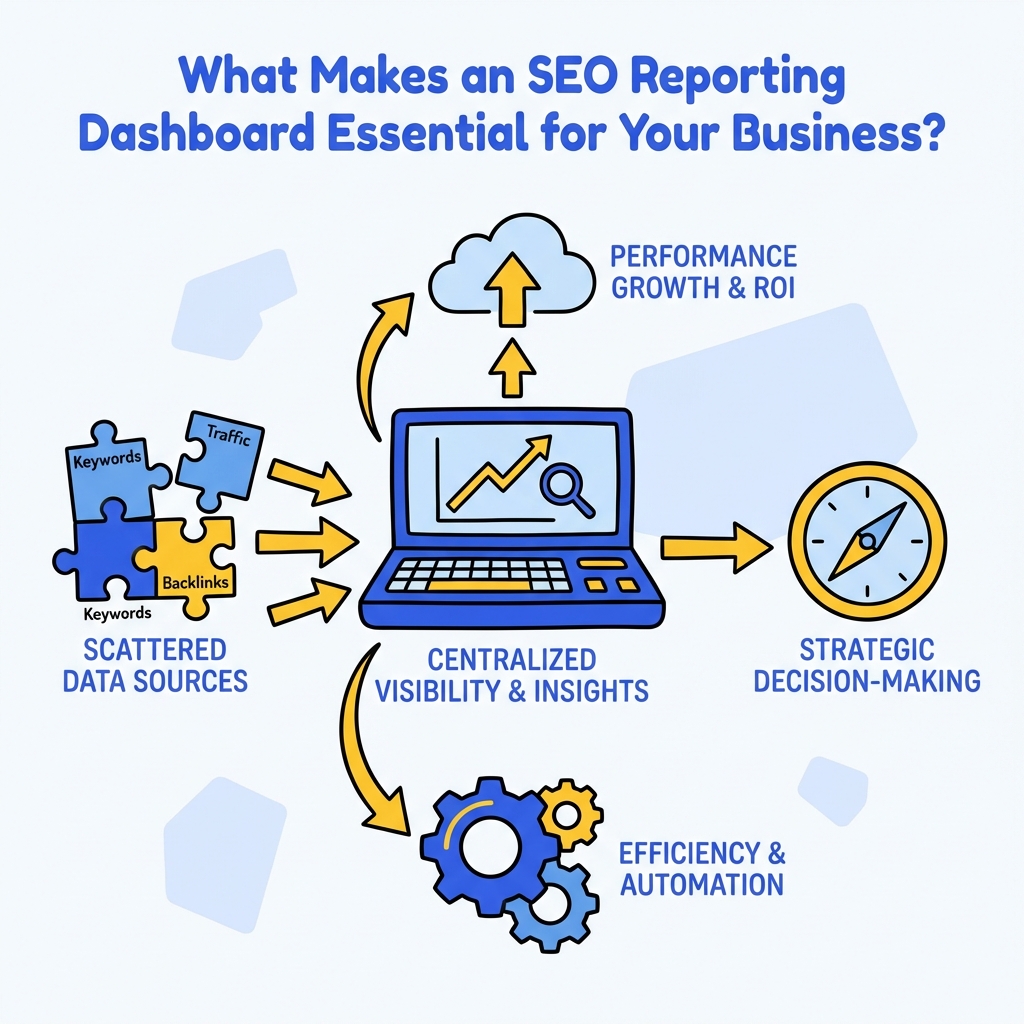
An SEO reporting dashboard serves as your command center for search engine optimization performance. Unlike scattered spreadsheets or individual tool reports, a centralized dashboard provides immediate visibility into how your SEO strategies are performing across all channels and campaigns.
The primary value lies in its ability to transform complex data into digestible insights. When you can visualize your organic traffic trends, keyword rankings, and conversion metrics in one place, you eliminate the time-consuming process of logging into multiple platforms and manually compiling reports. This streamlined approach allows you to spot opportunities and issues faster than ever before.
Modern SEO reporting dashboards also enable better stakeholder communication. Whether you're presenting to clients, executives, or team members, having a visual representation of your SEO performance makes it easier to demonstrate value and justify continued investment in search engine optimization initiatives.
How Do You Choose the Right Metrics for Your SEO Dashboard?
Selecting the appropriate metrics forms the foundation of any successful SEO reporting dashboard. The key is focusing on indicators that directly correlate with your business objectives rather than vanity metrics that look impressive but don't drive action.
Start with organic traffic metrics, including total sessions, unique visitors, and traffic trends over time. These foundational numbers provide context for all other performance indicators. Next, incorporate keyword ranking data for your target terms, but focus on rankings that generate actual business value rather than tracking every possible keyword variation.
Conversion-focused metrics deserve prominent placement in your dashboard. Track goal completions, form submissions, phone calls, or e-commerce transactions that originate from organic search. These metrics directly demonstrate the return on investment from your SEO efforts and help justify resource allocation for future campaigns.
Essential Dashboard Metrics Breakdown
| Metric Category | Primary KPIs | Secondary KPIs | Reporting Frequency |
|---|---|---|---|
| Traffic Performance | Organic Sessions, Users | Page Views, Session Duration | Weekly |
| Ranking Visibility | Target Keyword Rankings | SERP Features, Click-through Rates | Bi-weekly |
| Technical Health | Core Web Vitals, Crawl Errors | Page Speed, Mobile Usability | Monthly |
| Conversion Impact | Goal Completions, Revenue | Lead Quality, Customer Lifetime Value | Weekly |
What Tools Should You Use to Build Your SEO Reporting Dashboard?
The tool selection process depends heavily on your technical expertise, budget constraints, and reporting requirements. Google Analytics 4 and Google Search Console provide essential free data sources that should anchor any SEO reporting dashboard, regardless of your chosen platform.
For businesses seeking comprehensive solutions, enterprise SEO platforms like SEMrush, Ahrefs, or Moz offer built-in dashboard capabilities with advanced customization options. These tools excel at combining multiple data sources and providing industry-specific benchmarks for performance comparison.
Alternatively, business intelligence platforms such as Google Data Studio, Tableau, or Power BI offer greater flexibility for creating custom visualizations. These solutions require more setup time but provide unlimited customization potential and can integrate data from virtually any source. The choice between pre-built and custom solutions should align with your team's technical capabilities and long-term reporting needs.
How to Set Up Your Dashboard Architecture for Maximum Impact?

Effective dashboard architecture follows a hierarchical information structure that guides users from high-level overviews to detailed insights. Begin with executive summary cards that display your most critical KPIs at the top of the dashboard, allowing stakeholders to quickly assess overall performance.
Organize subsequent sections by logical groupings such as traffic acquisition, content performance, technical health, and conversion tracking. Each section should include both current performance indicators and trend analysis to provide context for the numbers. This structure enables users to drill down into specific areas of interest without losing sight of the bigger picture.
Consider implementing multiple dashboard views for different audiences. Executives might prefer high-level summaries with clear trend indicators, while SEO specialists need detailed breakdowns with granular filtering capabilities. Creating role-specific dashboards ensures each stakeholder receives relevant information without unnecessary complexity.
Building Your Dashboard Framework
The technical implementation begins with establishing data connections between your chosen platform and various SEO tools. Most modern dashboard solutions offer native integrations with popular SEO platforms, simplifying the initial setup process. However, you may need to configure custom API connections for specialized tools or proprietary data sources.
Data refresh frequency requires careful consideration based on your reporting needs and tool limitations. While some metrics like keyword rankings change daily, others such as backlink profiles update less frequently. Configure automatic refresh schedules that balance data freshness with system performance and API rate limits.
How Can You Ensure Data Accuracy and Reliability?
Data integrity forms the backbone of any useful SEO reporting dashboard. Implement validation checks to identify discrepancies between different data sources and establish protocols for investigating unusual fluctuations in key metrics.
Regular auditing of your data connections helps prevent reporting errors that could lead to misguided strategic decisions. Set up automated alerts for significant changes in critical metrics, enabling quick investigation of potential data issues or genuine performance shifts. When working with AI-powered SEO analysis, these validation processes become even more crucial for maintaining accuracy.
Documentation plays a vital role in maintaining dashboard reliability over time. Create clear definitions for each metric, including calculation methods and data sources. This documentation ensures consistency when team members change and helps troubleshoot discrepancies when they arise.
What Visualization Techniques Drive Better Decision Making?
Effective data visualization transforms raw numbers into compelling narratives that inspire action. Choose chart types that match your data characteristics, using line graphs for trend analysis, bar charts for comparisons, and gauge charts for goal tracking.
Color coding should follow intuitive conventions, with green indicating positive performance, red highlighting areas needing attention, and neutral colors for baseline metrics. Consistent color schemes across all dashboard elements reduce cognitive load and improve user comprehension.
Interactive elements such as date range selectors, metric filters, and drill-down capabilities enhance dashboard utility by allowing users to explore data from multiple angles. However, avoid over-complicating the interface with excessive interactivity that might confuse less technical users.
How Do You Automate Reporting and Save Time?
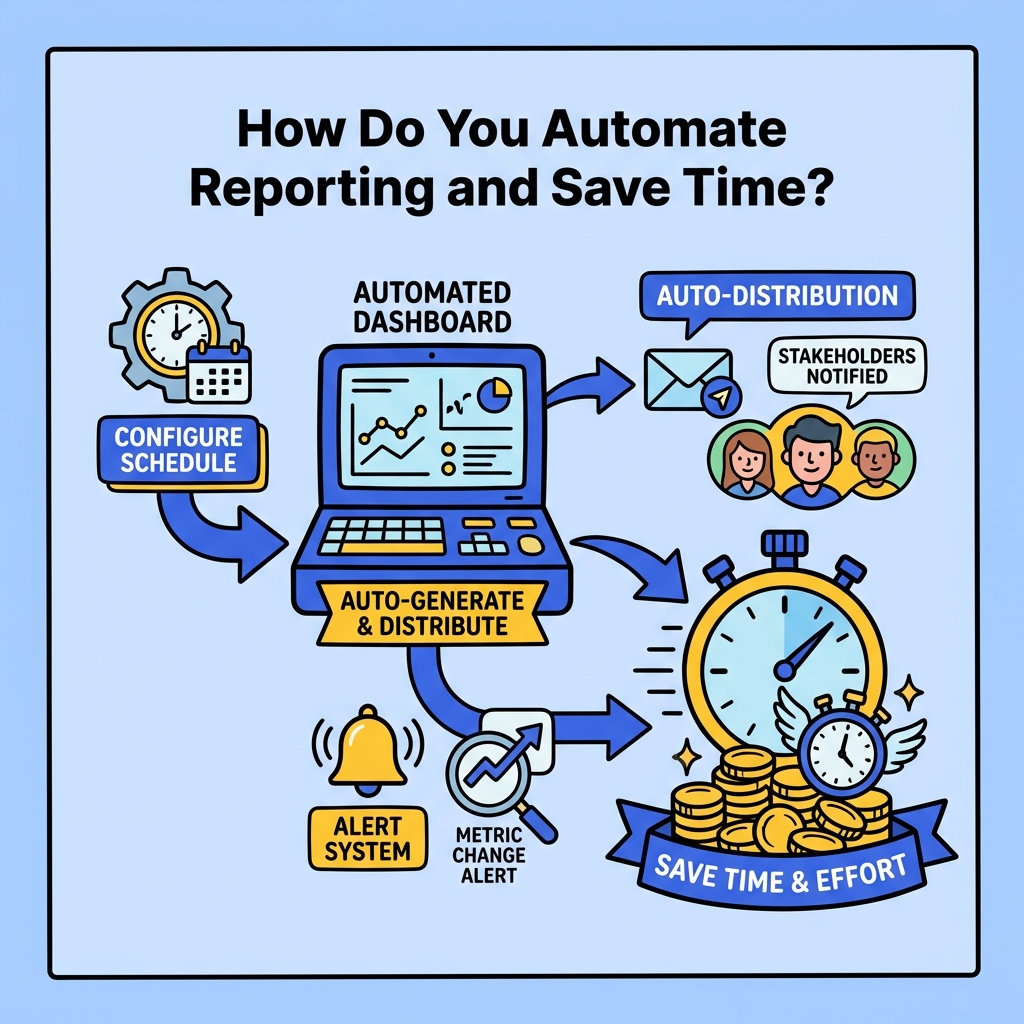
Automation capabilities distinguish professional SEO reporting dashboards from manual reporting processes. Configure scheduled reports that automatically generate and distribute performance summaries to relevant stakeholders at predetermined intervals.
Alert systems can notify team members when metrics exceed predefined thresholds, enabling proactive responses to both opportunities and problems. For example, set up notifications for significant ranking improvements that might warrant increased content investment or traffic drops that require immediate investigation.
Integration with project management tools can automatically create tasks based on dashboard insights, ensuring that identified opportunities translate into actionable work items. This connection between reporting and execution helps close the loop between analysis and implementation. Understanding ROI of SEO automation becomes crucial when implementing these automated processes.
How Should You Present Dashboard Insights to Different Stakeholders?
Stakeholder communication requires tailoring dashboard presentations to match audience expertise and interests. Executive presentations should focus on business impact metrics such as organic revenue growth, lead generation improvements, and competitive positioning gains.
Technical team presentations can include more granular data such as crawl error trends, page speed improvements, and indexation status changes. Marketing teams benefit from content performance metrics, keyword opportunity identification, and campaign attribution analysis.
Create standardized reporting templates that ensure consistent communication while allowing for customization based on specific audience needs. Include contextual explanations for significant changes and recommended actions based on dashboard insights.
What Common Mistakes Should You Avoid When Building Your Dashboard?
Many organizations fall into the trap of tracking too many metrics without focusing on actionable insights. Resist the temptation to include every available data point, instead prioritizing metrics that directly inform strategic decisions and tactical improvements.
Neglecting mobile optimization for dashboard viewing creates accessibility issues for stakeholders who need to review performance on mobile devices. Ensure your dashboard renders properly across different screen sizes and maintains functionality on tablets and smartphones.
Failing to establish baseline measurements and benchmarks makes it difficult to assess whether performance changes represent genuine improvements or normal fluctuations. Historical context provides essential perspective for interpreting current performance levels. When conducting SEO content audits, this historical perspective becomes invaluable for understanding content performance trends.
How Do You Scale Your Dashboard as Your Business Grows?
Scalability planning ensures your SEO reporting dashboard continues providing value as your business expands. Design flexible data structures that can accommodate additional websites, geographic markets, or product lines without requiring complete dashboard reconstruction.
Consider implementing user access controls and permission systems that allow different team members to view relevant dashboard sections while maintaining data security. As teams grow, role-based access becomes essential for maintaining dashboard organization and preventing information overload.
Plan for increased data volume by selecting platforms that can handle growing datasets without performance degradation. Cloud-based solutions typically offer better scalability than on-premise alternatives, but evaluate costs associated with increased data processing and storage requirements.
Conclusion
Building an effective SEO reporting dashboard requires strategic thinking, technical implementation, and ongoing optimization to deliver maximum value for your organization. By focusing on business-relevant metrics, choosing appropriate tools, and designing user-friendly interfaces, you create a powerful asset that transforms SEO data into actionable insights.
The investment in dashboard development pays dividends through improved decision-making speed, enhanced stakeholder communication, and more efficient resource allocation for SEO initiatives. Remember that your dashboard should evolve alongside your business needs, incorporating new metrics and capabilities as your SEO strategy matures.
Ready to transform your SEO reporting process? Start by identifying your most critical business metrics and exploring dashboard solutions that align with your technical capabilities and budget constraints. The right SEO reporting dashboard becomes an indispensable tool for driving sustainable organic growth and demonstrating clear return on investment from your search engine optimization efforts.

Stefan Winter
Founder & SEO Expert
Founder of Fast SEO Fix and SEO automation expert. Stefan built Fast SEO Fix to solve the tedious problem of manual SEO work. He specializes in SEO optimized content generation, keyword research, and automated SEO strategies.